Loading...
Loading...
CollEc is a RePEc service that evaluates the economic literature's co-authorship network. It allows you to assess bilateral distances and centrality measures like closeness and betweenness for authors. As in GraphEc, you interact with the results through graphical representations. Feel free to watch the following tutorial for a brief introduction to CollEc's functionalities. Note that the video player depends on your browser. In some browsers you may need to right-click on the video to select the full screen option.
The underlying co-authorship data is derived from the RePEc Author Service. Further details are available in the documentation.
CollEc constructs and examines the co-authorship network using methods from the field of network analysis. Assuming no computer science background on the side of many CollEc users, this documentation begins with a short introduction on the basics of networks.
Graphs, i.e. networks, exist in many different applications. Those include websites on the internet, geo-spatial data, social media connections, co-authorship among economists etc. A graph consists of vertices, also called nodes, that are connected via edges. A vertex is e.g. a location in geo-spatial data, a registered social media user, a website or a researcher. Edges between vertices are e.g. roads between locations, links to other websites, co-authorship between economists etc. Both vertices and edges have attributes. A typical vertex attribute is a name. That might be the name of a location, or as in the case of CollEc the name of an economist who published co-authored research. A common edge attribute is weights. Weights express the transition costs between vertices. In geo-spatial applications the weight might express the distance between locations. In CollEc the weight represents the degree of collaboration, i.e. the number of papers two authors wrote together. Edge weights are determined by transition functions. In CollEc you can interactively choose between different function forms that model the transition cost between co-authors as a non-linear function of the number of joint papers. The transition costs are symmetric as CollEc uses undirected graphs. Moving from author A to author B is as costly as moving from B to A.
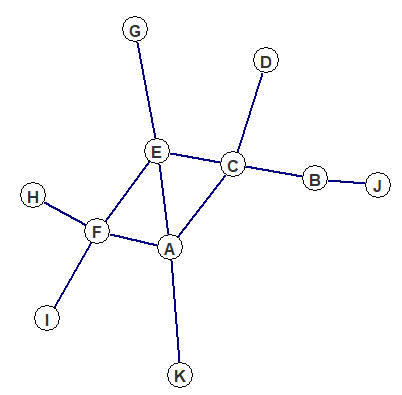
The following plot illustrates the concept of graphs. Authors A to K, the white vertices, are connected by joint research, the blue edges.
CollEc's network currently consists of authors registered through the RePEc Author Service, a RePEc service maintained by Christian Zimmermann. They are the subset of the around 59,000 people in the RePEc Author Service data who have at least one co-authored paper listed on RePEc. Not all of them are connected to the same graph. In fact there are over 900 unconnected sub-graphs. The largest one of them contains with people the vast majority of vertices. The remaining graphs are small and consist of e.g. two otherwise unconnected people who published a joint paper. You can find an author's graph order, i.e. the graph or network size, below distance, closeness and betweenness plots and co-author graphs.
The computed distance is the length of the shortest cost path between the two selected authors. Edge weights measure the distance between adjacent authors. The shortest cost path is, thus, the connection between two authors that minimizes the sum of edge weights, the path's length. Since the input is an undirected graph with exclusively positive weights the shortest paths are derived through Dijkstra's algorithm. The generated distance values are comparable within but not between transition functions.
If you set Weighted Edges to No, edges are not weighted by the number of joint papers. Instead they all receive a weight of one. So they are in fact weighted. But with all weights set to the same value the weights do not play a role.
If you set Weighted Edges to Yes and Transition Function to Inverse, edges are weighted by the inverse of the quanitity of joint papers:
$$W_{i,j} = N_{i,j}^{-1}$$
If you set Weighted Edges to Yes and Transition Function to Gravity, edges are weighted by the inverse of the squared quanitity of joint papers:
$$W_{i,j} = N_{i,j}^{-2}$$
If you set Weighted Edges to Yes and Transition Function to Exponential, edges are weighted by an exponential function based on the quanitity of joint papers:
$$W_{i,j} = \exp \left( \frac{1 - N_{ij}}{2} \right) $$
The following figure illustrates how the different transition functions translate number of joint papers into edge weights. If two authors only collaborated on one paper, it does not matter which transition function is selected. They all attribute a value of one to this connection. Beyond the first paper, the effect varies between functions. Inverse, Gravity and Exponential all model diminishing returns to co-authorship with the same person. However, with Gravity the edge weight, i.e. the transition cost or the distance, drops more drastically over the first few papers than it does with Inverse and Exponential.
CollEc users access bilaterial distances through a plot of the following type.
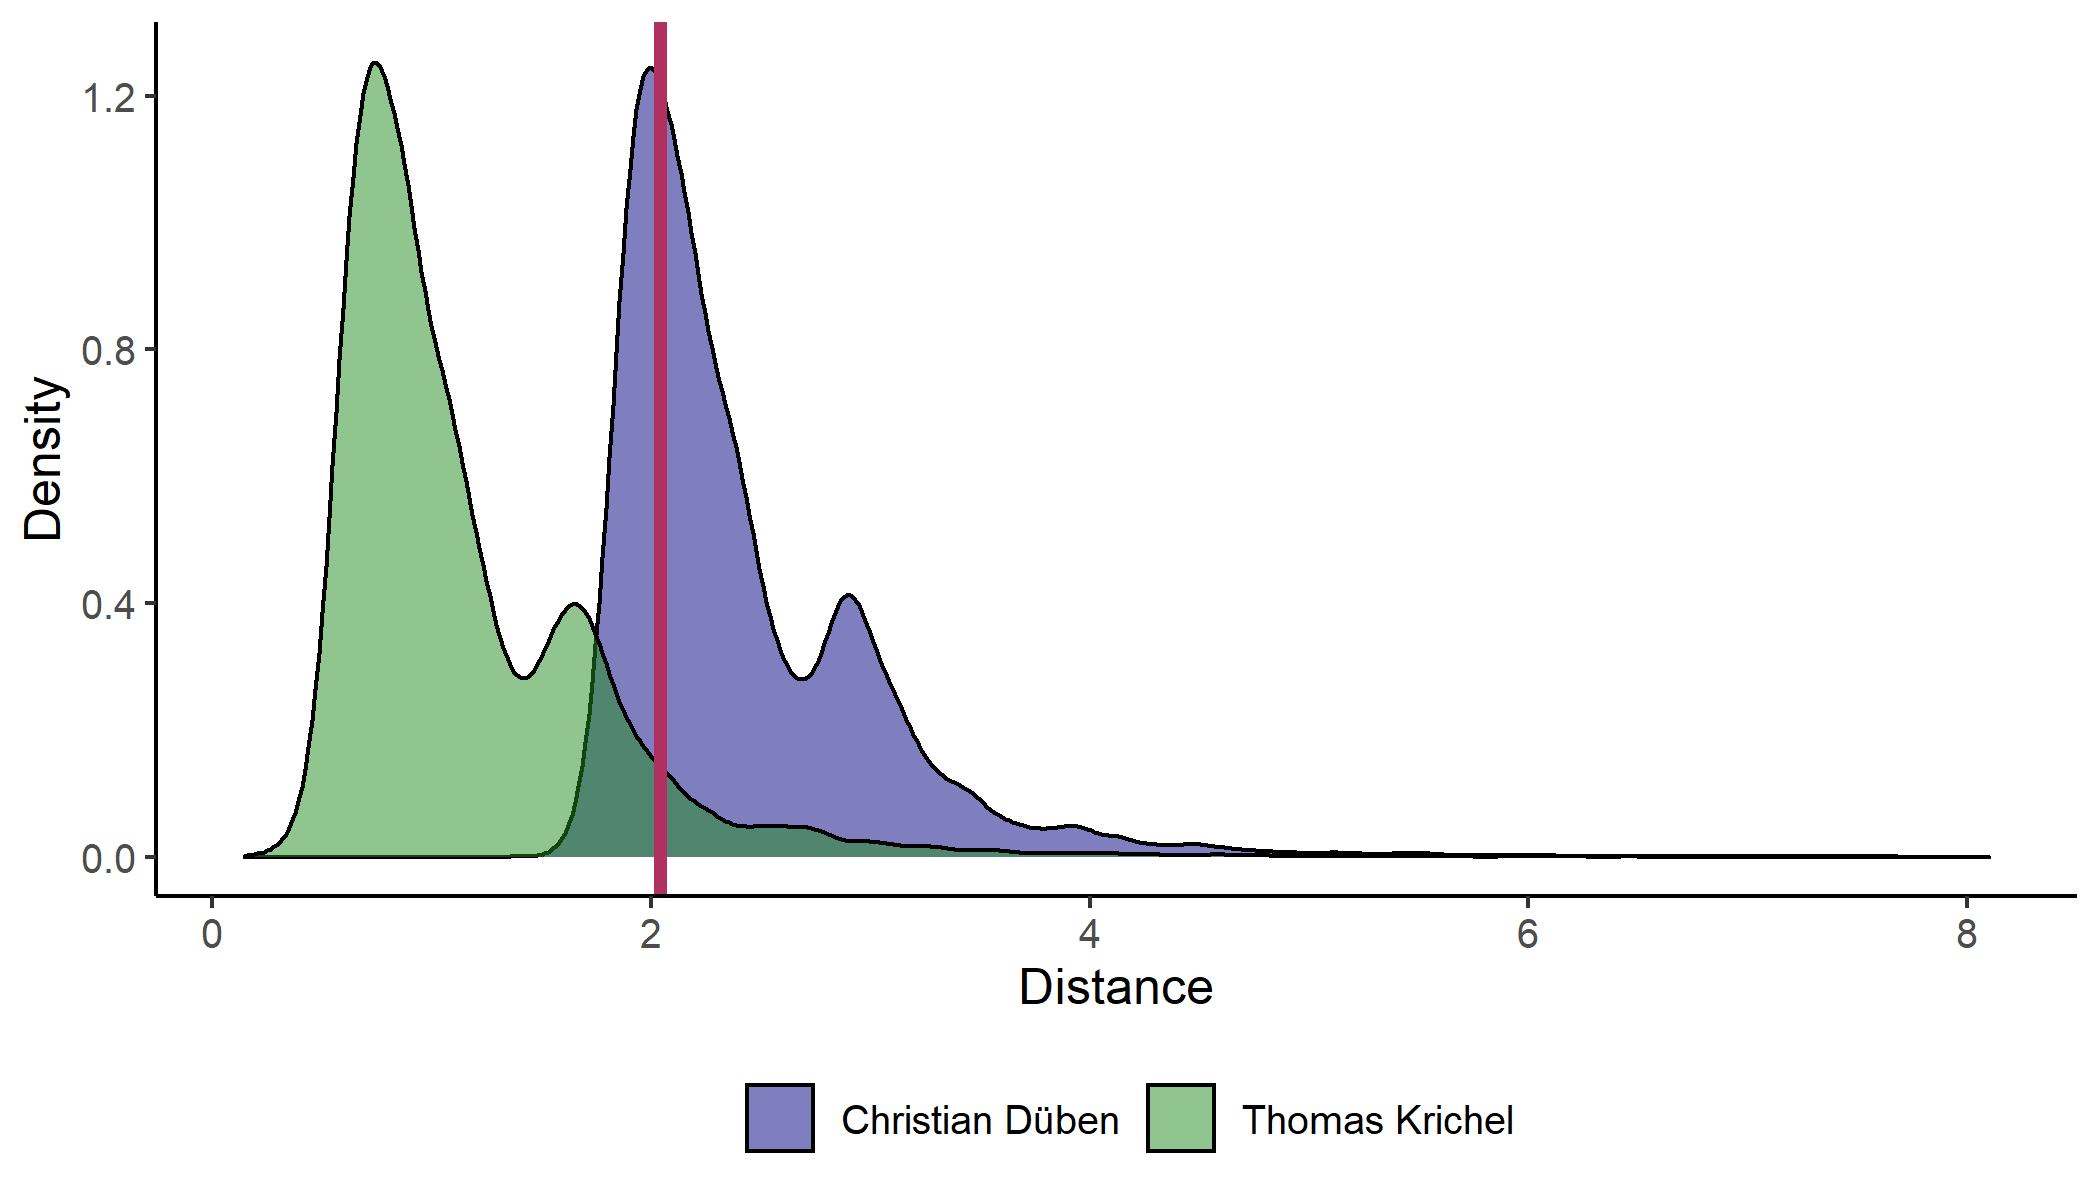
In this example, the selected authors are Christian Düben and Thomas Krichel and distances are based on the inverse transition function. The two distributions represent the kernel density estimates of distances from the two authors. The curves are similar in shape but shifted along the horizontal axis. Thomas Krichel is closer to many authors in the graph than Christian Düben is. Junior researchers like Christian Düben tend to be less closely connected than people like Thomas Krichel who have been in the field for decades. The red line denotes the bilateral distance between the two selected authors. It is slightly above the blue distribution's mode and somewhere in the green distribution's upper tail. From Thomas Krichel's perspective, Christian Düben is a fairly distant author. While from Christian Düben's perspective, Thomas Krichel is just as far as many other authors are. A short text underneath the plot states the graph size and bilateral distance. The two authors in this example are part of the main graph with around 45,000 people and are located at a distance of around 2.043.
Closeness, or closeness centrality, is the reciprocal of the sum of the length of the shortest paths between a vertex and all other vertices. High closeness values imply short paths to other vertices and thus a central position.
$$C(v) = \frac{1}{\sum_{i \neq v} d(v,i)}$$
\(d(v,i)\) is the length of the shortest cost path between vertex \(v\) and vertex \(i\). Given the constant inflow of new authors into the network, closeness values are not comparable over time.
A closeness plot with Nobel prize laureate Esther Duflo as selected author and distances based on the exponential transition function looks as follows.
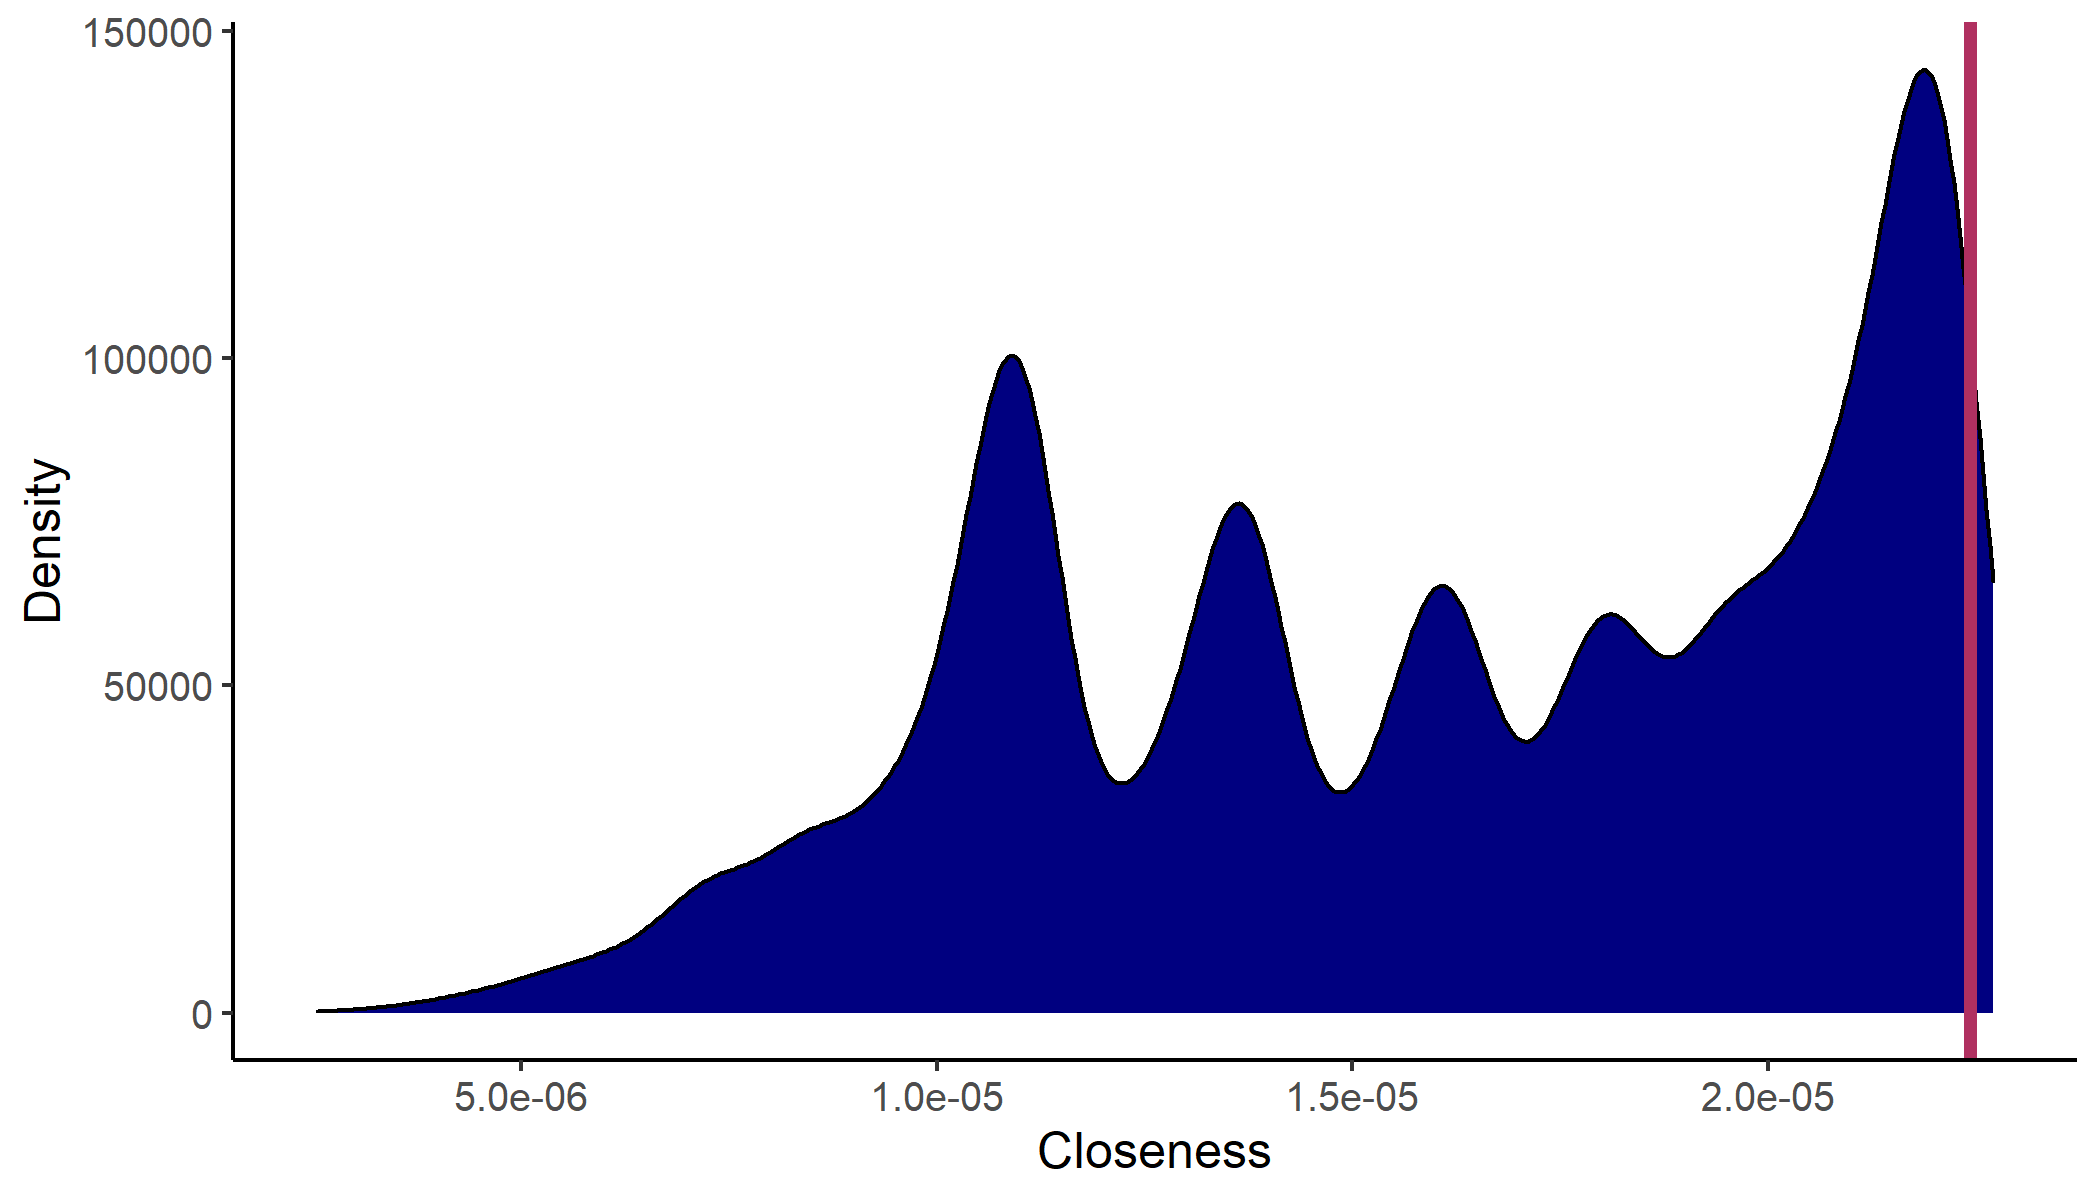
The blue distribution illustrates kernel density estimates of all authors' closeness values in that graph. Esther Duflo is part of the main graph which contains around 45,000 authors and with it around 45,000 closeness values. She is with a closeness of around 2.24e-05 one of the most centrally located economists. The red line representing that value is near the upper end of the closeness distribution. Graph size and closeness value are stated in a short text underneath the plot.
Betweenness, or betweenness centrality, measures the number of shortest paths passing through a vertex. High betweenness values imply high centrality.
$$B(v) = \sum_{i \neq v \neq j} \frac{\sigma_{ij}(v)}{\sigma_{ij}}$$
\(\sigma_{ij}\) represents the number of shortest paths from vertex \(i\) to vertex \(j\). And \(\sigma_{ij}(v)\) is the number of those paths passing through vertex \(v\). Given the constant inflow of new authors into the network, betweenness values are not comparable over time.
A betweenness plot with Nobel prize laureate Abhijit Banerjee as selected author and distances based on the gravity transition function looks as follows.
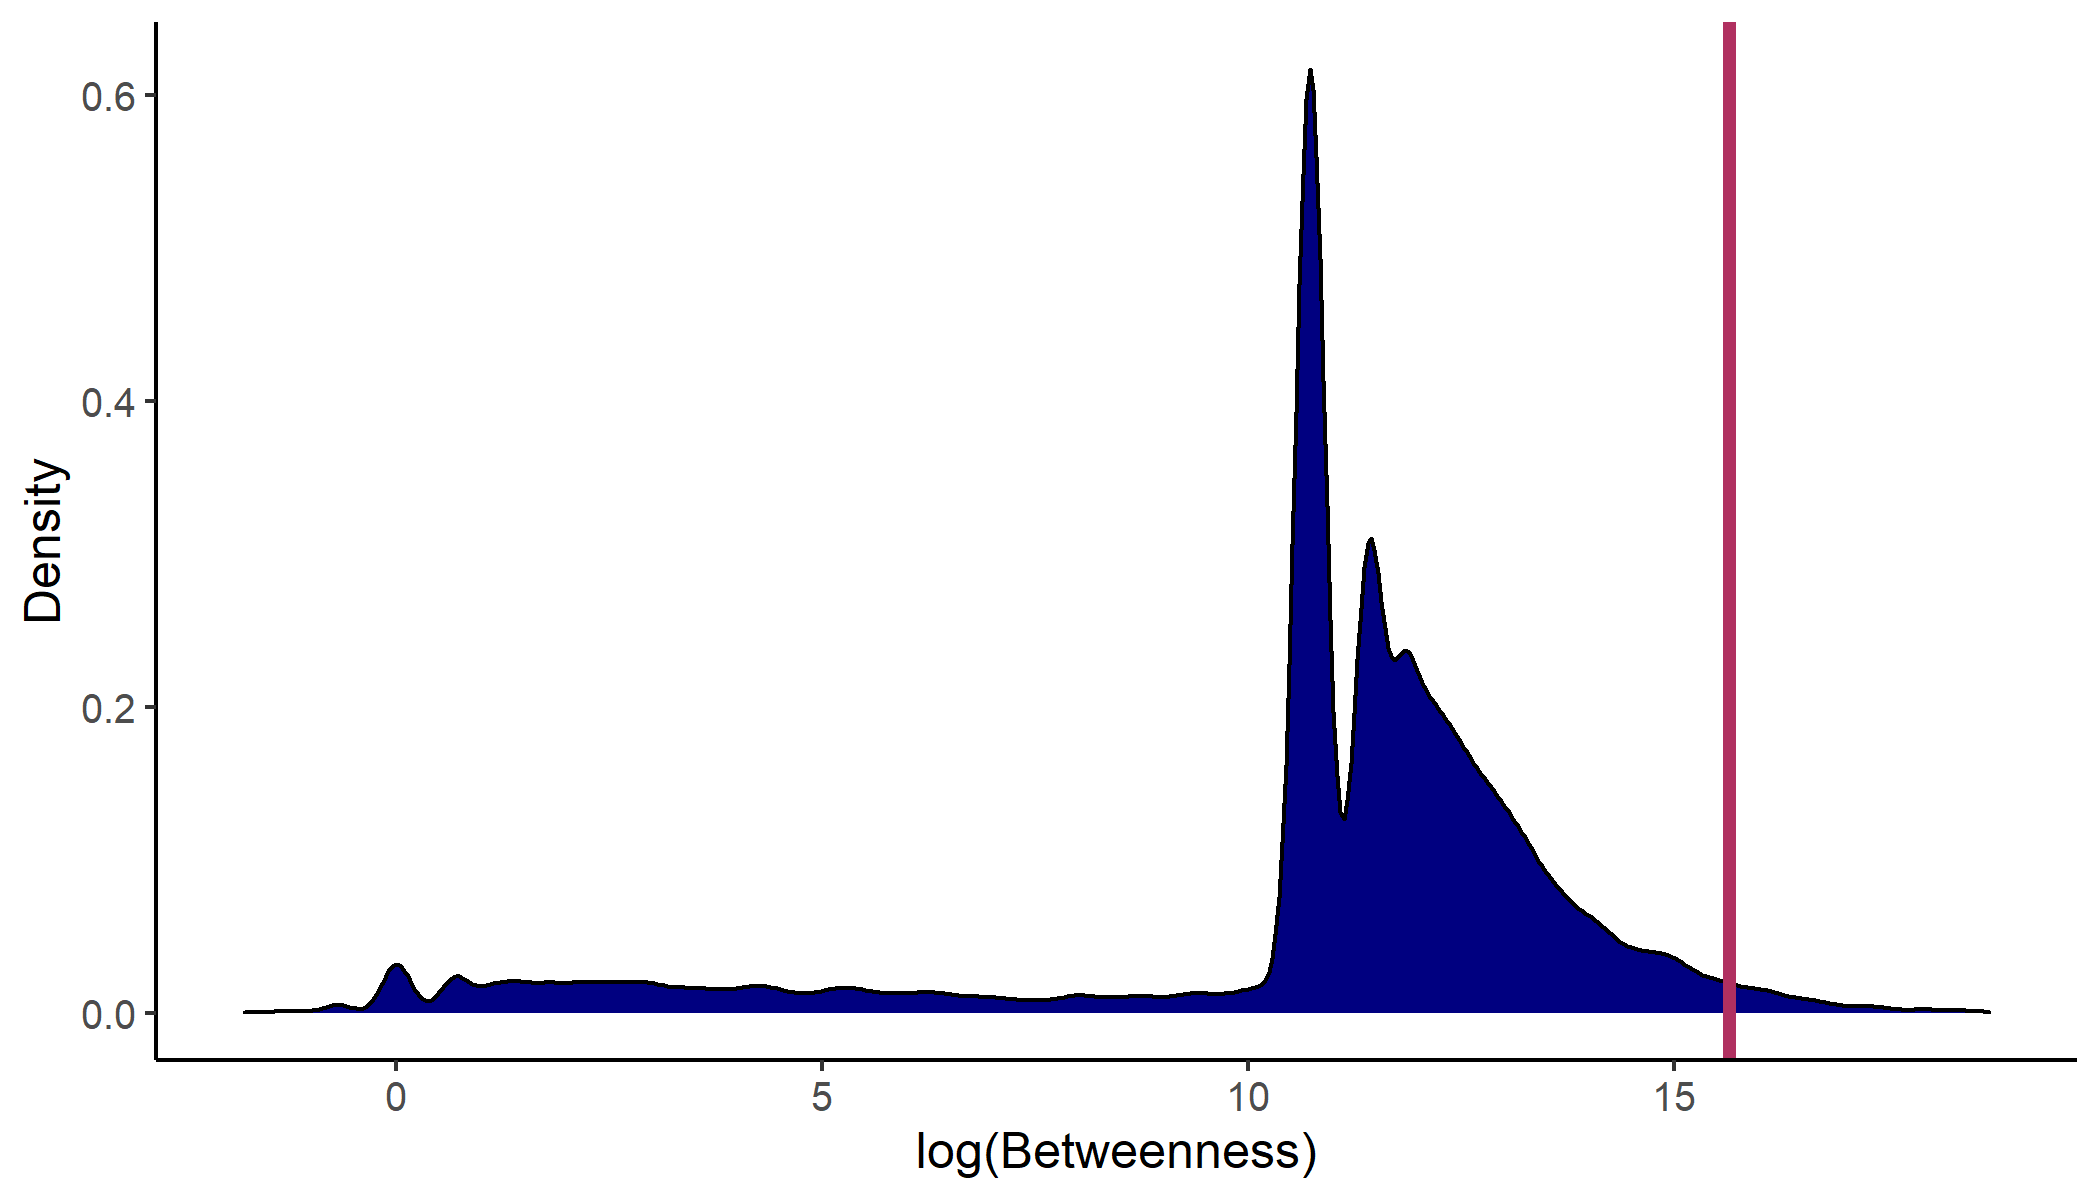
The blue distribution illustrates kernel density estimates of all authors' log betweenness values in that graph. It displays the logarithm of betweenness because the distribution of actual betweenness is so wide that its shape can merely be guessed from a plot of this size. Abhijit Banerjee is part of the main graph which contains around 45,000 authors and with it around 45,000 betweenness values. He is with a betweenness of around \(\log(6,188,136) \approx 15.638 \) one of the most centrally located economists. The red line representing that value is near the upper end of the betweenness distribution. Graph size and betweenness value are stated in a short text underneath the plot.
The co-authors tab is functionality that displays interactive fragments of the network. These fragments are the subset including a selected author, his or her co-authors and the co-authorship links between them. The selected author's vertex is depicted in red and the co-authors' vertices are depicted in blue. The interactive functionalities include zooming into the graph, dragging vertices around and selecting vertices, which highlights co-authorship links.
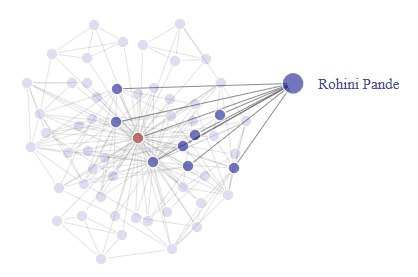
This example graph is the result of selecting Esther Duflo as the author of interest and then dragging her co-author Rohini Pande's vertex out of the cloud of vertices. The nodes highlighted in darker colors are Esther Duflo and Esther Duflo's co-authors that are also Rohini Pande's co-authors.
When edge weights do not account for the number of joint papers and shortest paths only minimize the number of authors, the probability of have multiple shortest paths between two authors is particularly high. Instead of randomly selecting one of them, the Shortest Paths tab displays the path with the highest number of papers within that subset. For computational efficiency reasons these two steps are aggregated into a single transition function: \(W_{i,j} = 1 - 0.001 \, N_{i,j} \). This function is only used in that particular functionality and not in any other part of the application.
CollEc retrieves information on co-authorship from the RePEc Author Service. In particular, it extracts a vector of authors from each co-authored paper. These are then merged into a graph with edges weighted according to one of the four transition functions. Any result available in this web application is derived from one of these graphs. The respective code is written in R with the graph construction and analysis executed through the igraph package. igraph is a wrapper for functions written in C and C++ which makes it very efficient. Calulating more than 2.2 billion shortest cost path lengths and writting them to disk only takes a few minutes in an eight CPU process.
Much of that data is inserted into a SQL database. Distances are an exception. Despite various optimizations, computing distances directly from the graph when a user interacts with the web application turns out to be more efficient than the database approach.
Betweenness calculations using the exponential transition function include values small enough to crash the machine and are, thus, not implemented at this point.
CollEc retrieves RePEc Author Service data and computes the respective results once a day. Check the footer for the current update status. The respective processes, i.e. the database and the R script generating the data, are executed from within Docker containers.
The web application is written in R Shiny, which merges server-side R with client-side HTML, CSS and Javascript. It reads data from the above mentioned SQL database and displays it. The process generating the data and updating the database once a day runs independently of the web application.
CollEc uses ShinyProxy to deploy the app. When a user visits the website, the itself containerized ShinyProxy spins up the app through another Docker container.
The CollEc application's server runs on electricity generated from renewable energy sources, i.e. wind and hydro power.
CollEc does not set any cookies apart from the ones necessary to navigate a Shiny web application. Users are not tracked anywhere outside this website and are not analyzed. There are no personalized ads and no data is shared with third parties. Dropdown menu selections, including author names, transition functions etc., are only stored as long as a session is active. They are, therefore, deleted within minutes of a user's inactivity.
ShinyProxy logs access times, container crashes etc. but does not track what happens within the app. The underlying R session's output is usually not printed to a file, except during testing and debugging by the maintainer.
CollEc's decision not to track and analyze users and web application usage is motivated by compliance with strict European regulation. Instead of directly observing who uses the app and how the app is used, CollEc relies on users to explicitly report their experience. If you encounter any errors, long loading times or other issues, report them anonymously or contact the maintainer.
This privacy statement, including the extent to which data is stored and to which cookies are used, may change with future updates to the web application.
At this point, CollEc data is only available through this application's graphical output. A functionality to download the tabular data behind it will be added in one of the next updates. In the meantime you can use other RePEc data.
The default way of accessing this application is to visit http://collec.repec.org/app/collec_app, or simply http://collec.repec.org, and to set parameters via the graphical user interface. In some cases, however, you may want to directly enter the app at a certain stage other than the default landing page, e.g. at the closeness tab displaying your centrality plot. With a customized link you can point users from your website or from a presentation to a specific CollEc result. This web application does not allow you to arbitrarily define parameters via the URL. But it provides a set of well-defined entry points through which you can directly jump to the desired output.
Each URL entry point consists of three segments: a prefix, an input and values. The prefix is constant, i.e. identical across all entry points: http://collec.repec.org/app_direct/collec_app/?. The input, the second element, specifies the tab via the navbars parameter. Other parameters, such as author names, are passed as values. These are the variables set via the left panel in the graphical user interface. _input_ precedes the input and _values_ precedes the vector of values. Parameter values are passed as strings and therefore enclosed in double quotation marks represented by %22. They are case-sensitive, like the rest of the URL. In line with other RePEc services, authors are selected via their Short-ID rather than their full name. This avoids the ambiguity of duplicate names and special characters not permitted in URLs. Despite the Short-ID-based selection, output requested through the URL prints full names, the app's user-friendly default choice. Ampersands, &, concatenate the list of arguments.
The following paragraphs list the available entry points with the respective input argument and required values. Note that all of a tab's values must be defined unless stated otherwise.
Input: navbars=%22tab_Distances%22
Values: d_author1 (options: RePEc Short-ID; corresponding interface element: Author 1), d_author2 (options: RePEc Short-ID; corresponding interface element: Author 2), d_weighting_yn (options: yes, no; corresponding interface element: Weighted Edges), d_weighting_var (options: inverse, gravity, exponential; corresponding interface element: Transition Function, only needs to be set, when d_weighting_yn=%22yes%22)
Input: navbars=%22tab_Closeness%22
Values: c_author (options: RePEc Short-ID; corresponding interface element: Author), c_weighting_yn (options: yes, no; corresponding interface element: Weighted Edges), c_weighting_var (options: inverse, gravity, exponential; corresponding interface element: Transition Function, only needs to be set, when c_weighting_yn=%22yes%22)
Input: navbars=%22tab_Betweenness%22
Values: b_author (options: RePEc Short-ID; corresponding interface element: Author), b_weighting_yn (options: yes, no; corresponding interface element: Weighted Edges), b_weighting_var (options: inverse, gravity; corresponding interface element: Transition Function, only needs to be set, when b_weighting_yn=%22yes%22)
Input: navbars=%22tab_Coauthors%22
Values: g_author (options: RePEc Short-ID; corresponding interface element: Author)
Input: navbars=%22tab_Shortestpaths%22
Values: p_author1 (options: RePEc Short-ID; corresponding interface element: Author 1), p_author2 (options: RePEc Short-ID; corresponding interface element: Author 2), p_weighting_yn (options: yes, no; corresponding interface element: Weighted Edges), p_weighting_var (options: inverse, gravity, exponential; corresponding interface element: Transition Function, only needs to be set, when p_weighting_yn=%22yes%22)
The first version of CollEc dates back to the year 2011. It was developed by Thomas Krichel who also founded the RePEc Author Service. He wrote a software computing closeness and betweenness centrality using Perl and displayed the results on a static website. This legacy version is still available, but not updated anymore.
In 2020, after years of maintaining this project, Thomas Krichel transferred it to Christian Düben. With the new maintainer came a new implementation. CollEc was re-written from scratch. Migrating the network analysis from Perl to modern C and C++ code wrapped in R functions boosted efficiency and facilitated extensions to the analysis. The primary extensions are bilateral distances and weighted edges. The interface through which users view the data changed in various regards. Web applications' larger complexity compared to static websites gave the new maintainer the flexibility to fundamentally redefine how the data is presented. The new CollEc puts results into perspective using graphical output. When a user inquires the distance between two authors, CollEc generates a plot comparing that bilateral distance to the distances to all other authors in the network. A short text states further information on network size etc. The new CollEc evolves around the same approach as GraphEc, another recently developed RePEc service, does. It is a highly interactive tool presenting easily interpretable results and comparisons.
If you would like to contribute to CollEc, register with the RePEc Author Service and promote it among your colleagues. RePEc handles are unique identifiers that are assigned to everything listed in RePEc, from authors to papers, journals and working paper series. Especially in the case of authors they are a major advantage over bibliographic databases that only match by name. Duplicated names are very common in a field as large as economics. And creating a network based on names would be heavily distored. CollEc therefore constructs the co-authorship network using RePEc handles. And for an author to be assigned a RePEc handle he or she must register with the RePEc Author Service. Each additional registered economist with at least one co-authored paper fills in a missing link in CollEc.
Other types of contribution are also welcome. Feel free to contact CollEc's current maintainer Christian Düben with your suggestions. Errors in the web application can be reported anonymously or via e-mail to the maintainer.
Christian Düben is currently working on a CollEc-based paper which will be mentioned here at some point.